Google Analytics is one of the best ways to help you understand ways to reach your audience through digital marketing and drive traffic to your website. And best of all, it is a free tool offered by Google and relatively easy to incorporate into just about any website.
There is a tremendous amount of information that you can get from Google Analytics about the traffic on your site, but sometimes all of this information can be a little overwhelming, so I have created a dashboard to help you easily get some of the most important information.
To download the Google Analytics for Nonprofits dashboard, go to:
https://www.google.com/analytics/web/template?uid=YktZrArfQT6D4QQK0_2NJQ
After loading the dashboard template, adjust the date range for the report to a time period that fits what you are looking for. To look at general website info, I like to set the date range to a year.
You can also set the date to compare to previous periods – compare this year’s traffic to last year, etc.
Visits and Visitors
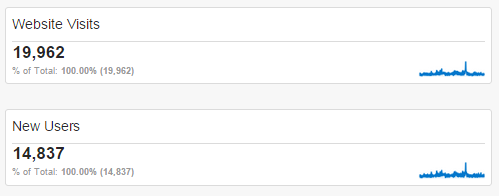
The first information is the amount of website visits and new users.
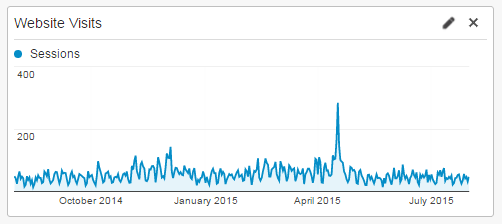
The second is a timeline that shows when the website had spikes in traffic. This organization had a fundraising event in April and experienced a high amount of traffic around that time.
Mobile Usage
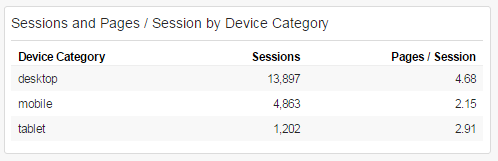
The next widget shows how much traffic came from desktop computers, mobile devices, and tablets. About 70% of this organization’s traffic was on desktop and 30% on mobile and tablet. The “Average Pages Per Session” is a useful figure to see the difference in engagement between desktop and mobile users. If mobile users are looking at less than half as many pages as a desktop user, that could indicate that the website is not mobile-friendly. (psst – we do responsive website design)
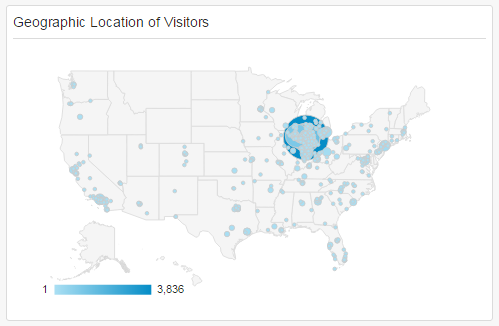
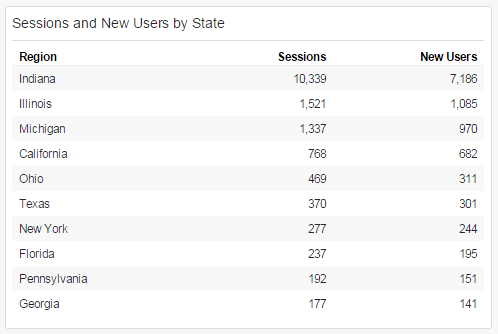
Geographic Location of Visitors
Track where your website visitors are coming from. This widget is configured to only show cities in the United States, but you can change the settings based on the needs of your organization.
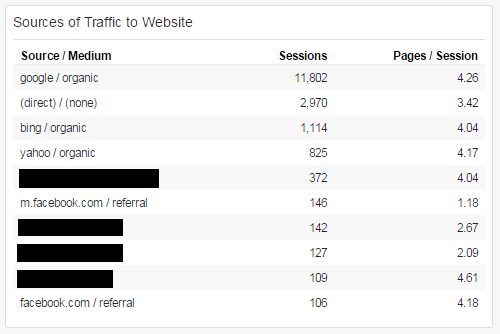
Sources of Traffic
This widget shows what channels are delivering traffic to your site. “Organic” refers to organic search engines (Google, Bing, Yahoo, etc.). “Direct” is people typing in your web address. Referrals are links to your website from other websites.
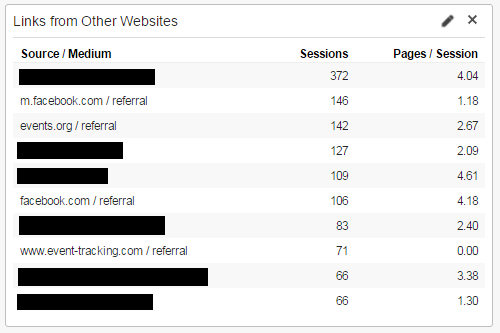
Referrals
Referrals are other websites that link to your website. Be wary of referrals like “siteevaluation.com”, “eventracking.com” or just about anything with “SEO” or “Buttons” in the website address, those are usually just bots crawling your website.
Search Keywords
This widget shows some of the keywords used in searches to get to your site. Ironically, Google Analytics doesn’t include seach terms used in Google searches (which accounts for about 85% of search traffic), so this relies on search results from Yahoo, Bing, etc. But, this can still be helpful in giving you a idea of some of the keywords people are using. I would also recommend changing the settings on this widget to filter out your organization’s name. In this example, all of the top 10 terms were variations of the organizations name. It seems that people are becoming increasingly lazy and not typing in “www.yourorganization.com”, and instead just typing “Your Organization” into the seach bar.

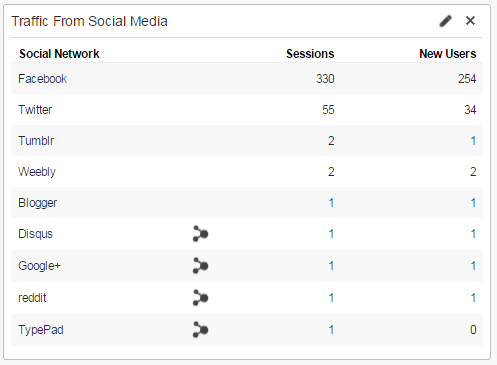
Traffic from Social Media
Good information to see if your social media efforts are paying off.
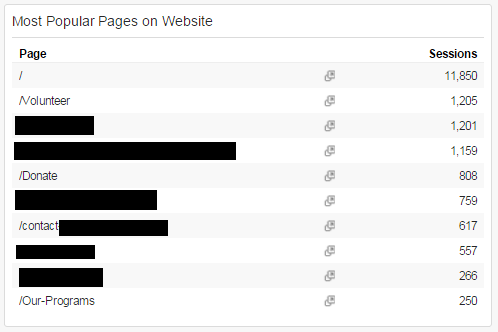
Most Popular Pages on Website
Ths widget shows what pages people are visiting. Usually, the home page (/) is the most popular.