I recently wrote a post about the importance of having a mobile-friendly website. I have created a dashboard in Google Analytics to see how your mobile traffic stacks up against your desktop traffic. If your mobile traffic doesn’t fare well against your desktop traffic, you might need to look at making the website more responsive.
To download the GA dashoboard, go to: https://www.google.com/analytics/web/template?uid=AeP-Hr5wRvSvOgaY68SshA
How important is Mobile traffic?
First, get a sense of how much traffic comes to your website from different device categories:
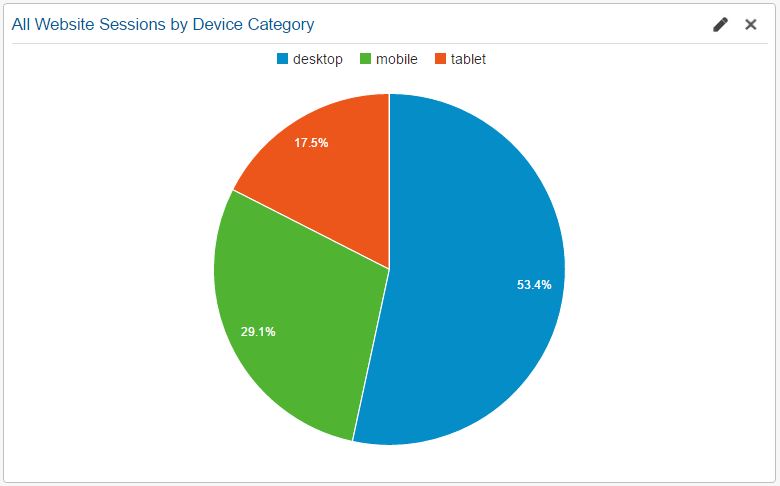
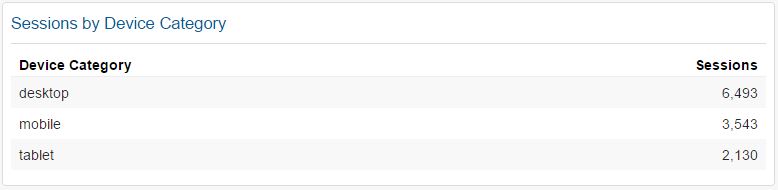
For this website, 53.4% of the traffic comes from desktop and 46.6% comes from mobile and tablet. With almost half of the traffic coming from mobile and tablet, you want to make sure that the website is responsive to those devices.
Engagement on Different Devices
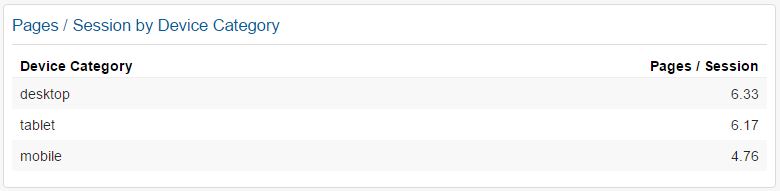
For most websites, I prefer to use Pages per Session as a basic tool to judge engagement on the website. We see that people using desktops view 33% more pages per session than they do on mobile (6.33 pages vs. 4.76 pages).
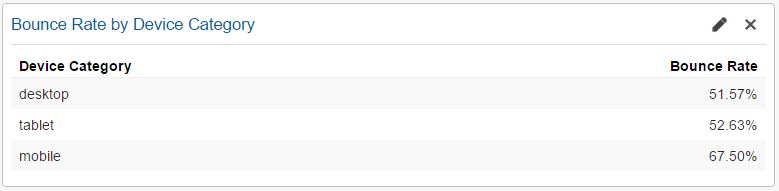
Bounce rate is another tool you can use to gauge the mobile experience. The Bounce Rate is essentially the percentage of people that view one page and leave the website. While the bounce rate on mobile is usually always higher than that on desktop, it is important to determine how much higher. In this case, the bounce rate on mobile is 30.9% higher than on desktop (67.50% vs. 51.57%).
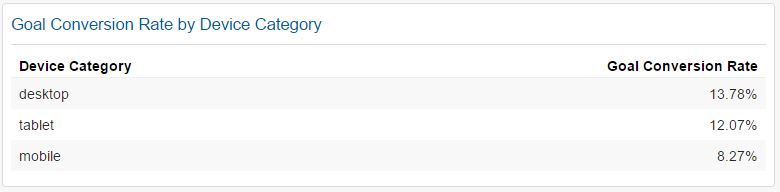
Goal Conversion Rate is also a very important metric to look. In this case, a person on mobile is 40% less likely to convert (8.27% vs. 13.78%).
By using this dashboard, you can judge how the mobile traffic compares to your desktop traffic. If you see a need to improve the mobile expereince, please feel free to contact us at Force 5 or call us at (574) 234-2060.